6. Transmission Function
6.1. PWV Scaling
The r, i, and z band mosaic filters of Kitt Peak National Observatory (grey) compared against the MODTRAN modeled atmospheric transmission function due to precipitable water vapor (blue). Atmospheric transmission functions are shown for an airmass of one and a (PWV) column density of 1 mm (top), 15 mm (middle), and 30 mm (bottom). Note that absorption features do not scale linearly with PWV, and some saturate at relatively low column densities.
6.2. Line Saturation and Binning
The atmospheric models used by pwv_kpno do not directly account for the smoothing that occurs in observed spectra due to a spectrograph’s spectral resolution function. As a result, directly dividing the observed and modeled spectra will produce a very high, unphysical flux for wavelengths where the transmission function is saturated. To account for any saturated features, the modeled transmission can be binned to approximately match the observed spectra’s resolution. Here we compare the modeled transmission function binned to two different resolutions for an airmass of one and a PWV column density of 1 mm (top), 15 mm (middle), and 30 mm (bottom).
6.3. Comparison to Observations
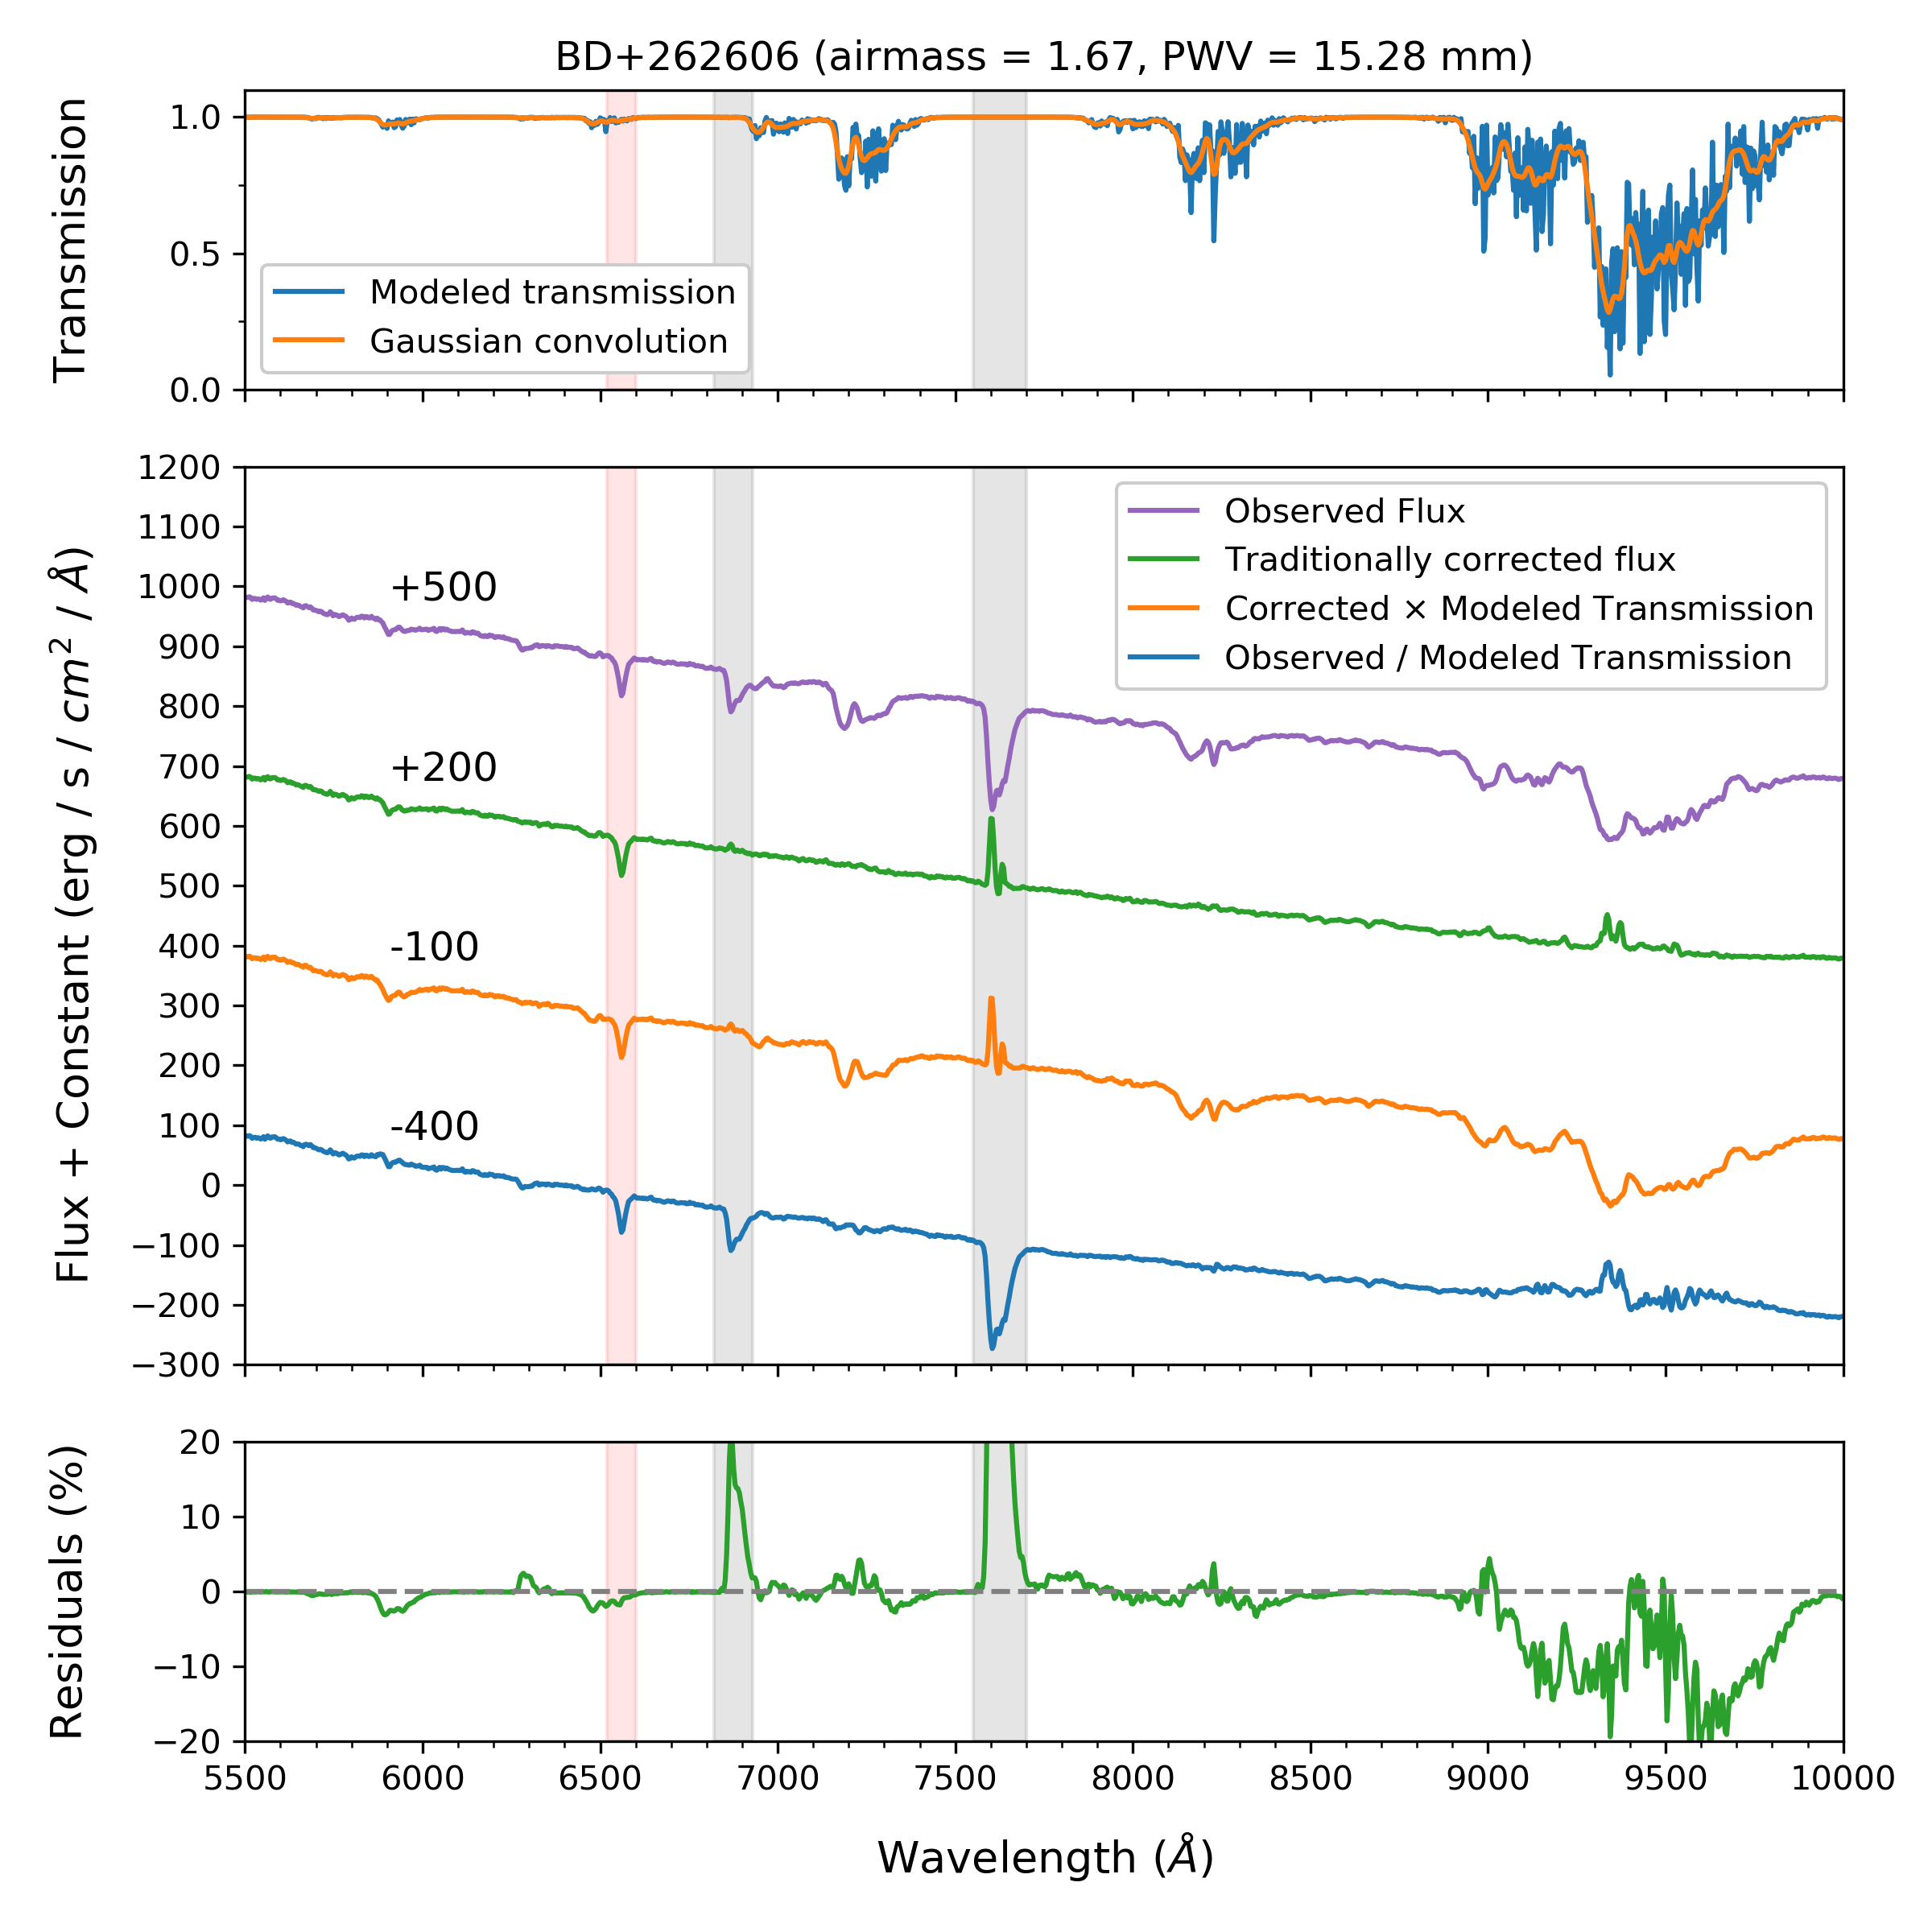
Observations of BD+262606 were taken using the R. C. Spectrograph at Kitt Peak National Observatory. The top panel demonstrates the modeled PWV transmission function at the time of observation (blue) smoothed by a Gaussian kernel (orange). The middle panel shows the observed spectrum (purple) and the spectrum corrected using catalog values (green). These are compared against the catalog corrected spectrum multiplied by the modeled transmission (orange) and the observed spectrum divided by the smoothed transmission (blue). Residuals between the catalog corrected and model corrected spectrum are shown in the bottom panel. Hydrogen-alpha lines are highlighted in red and O2lines in grey.
Corrections for the PWV absorption features agree reasonably well between the catalog and model corrected spectra. The largest deviations between the corrected spectra occur redward of 9,000 Angstroms. Some of these deviations can be attributed to cloudy observation conditions, creating large spatial and time variations in the PWV concentration along the line of sight. However, correcting this feature is also difficult since it is, in fact, a number of thin, saturated lines that have been blended together. Overall, we find that the model struggles to correct the observed spectra past 9,000 Angstroms, but performed well enough overall to be used to satisfactorily correct photometric observations.