3. PWV Modeling
In March of 2015, we installed SuomiNet connected weather station on top of the WIYN 3.5 meter telescope building at Kitt Peak National Observatory. In order to prevent equipment damage, the weather station at Kitt Peak is powered down during lightning storms. This procedure, combined with occasional hardware issues, creates gaps in the available SuomiNet data for Kitt Peak.
In order to determine the PWV level during periods without direct SuomiNet data, measurements from other nearby receivers can be used to model the PWV level at Kitt Peak. This model can also be used for times before the Kitt Peak receiver was installed.
3.1. Comparing Seasonal Trends
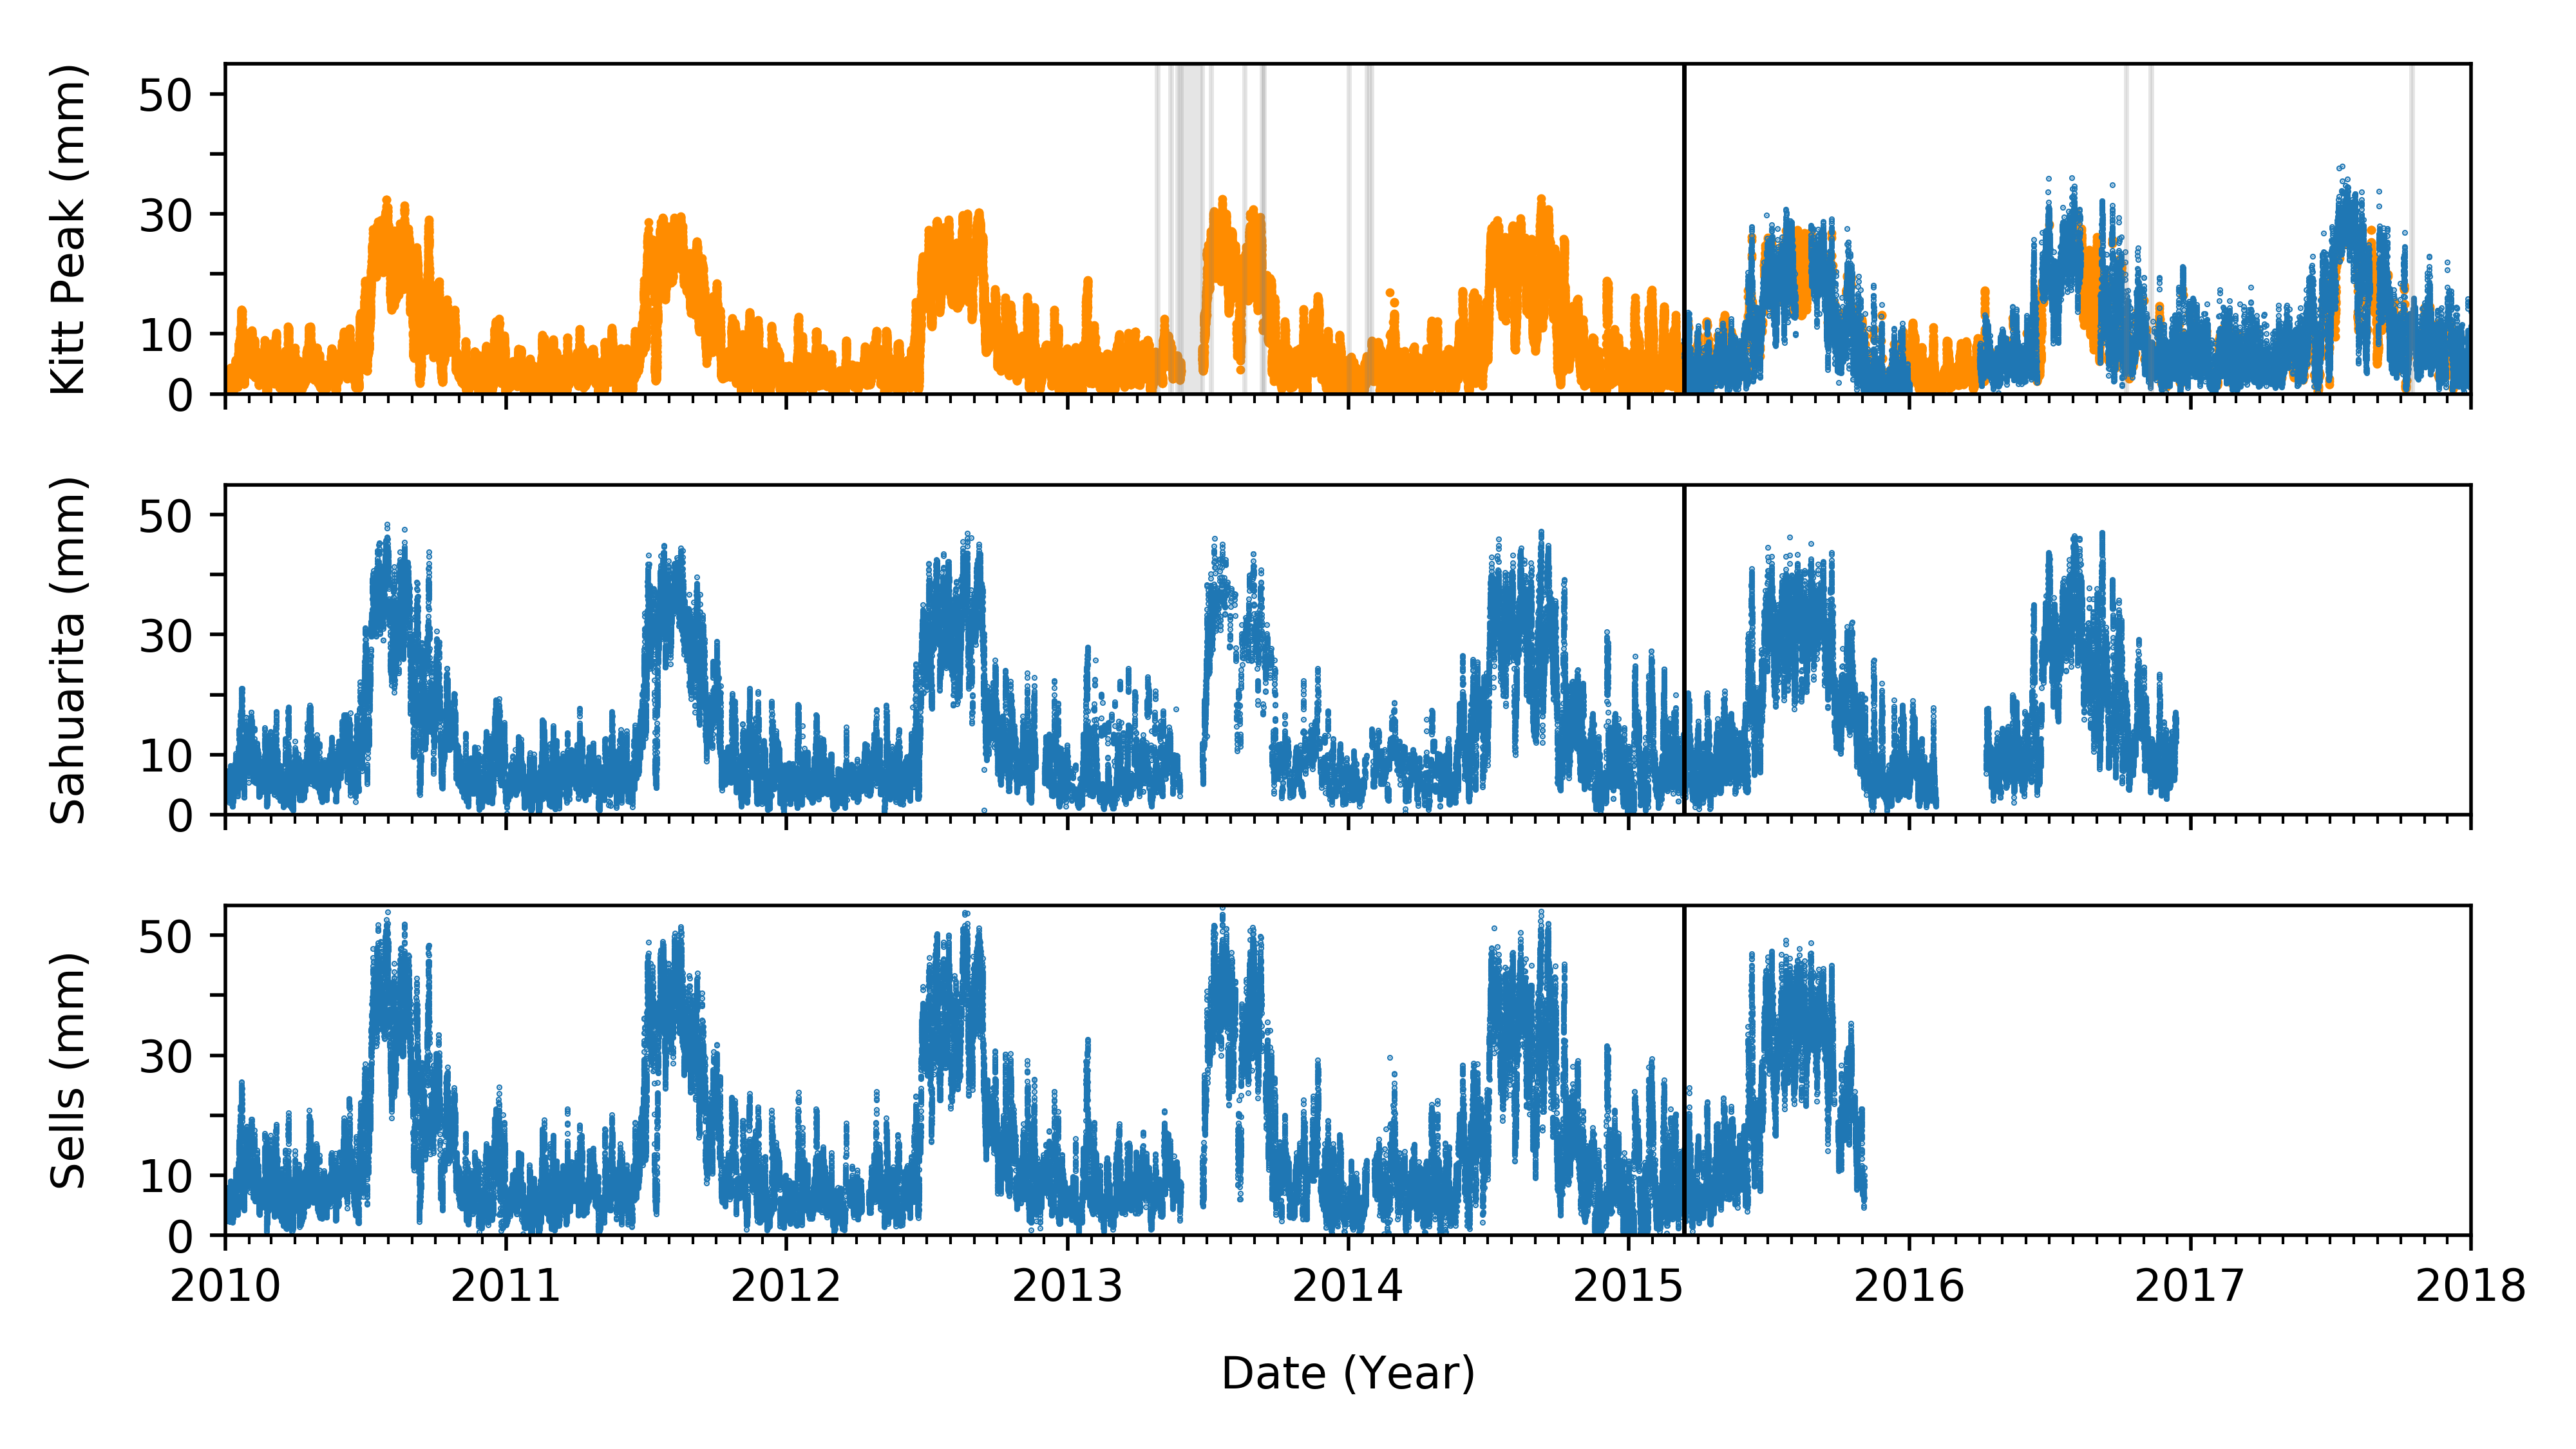
The figure below demonstrates measurements of precipitable water vapor (PWV) from the SuomiNet project from 2010 onward. From top to bottom, SuomiNet measurements for Kitt Peak National Observatory, Sahuarita AZ, and Sells AZ (Blue). The modeled PWV level at Kitt peak is shown in Orange. Periods of one day or longer where there are no modeled PWV values are shown in the top panel in grey. The geographic proximity of these locations means that the primary difference in PWV between locations is due to differences in altitude. Measurements were taken at Kitt Peak National Observatory begin in March of 2015.

3.2. Residuals of PWV Models
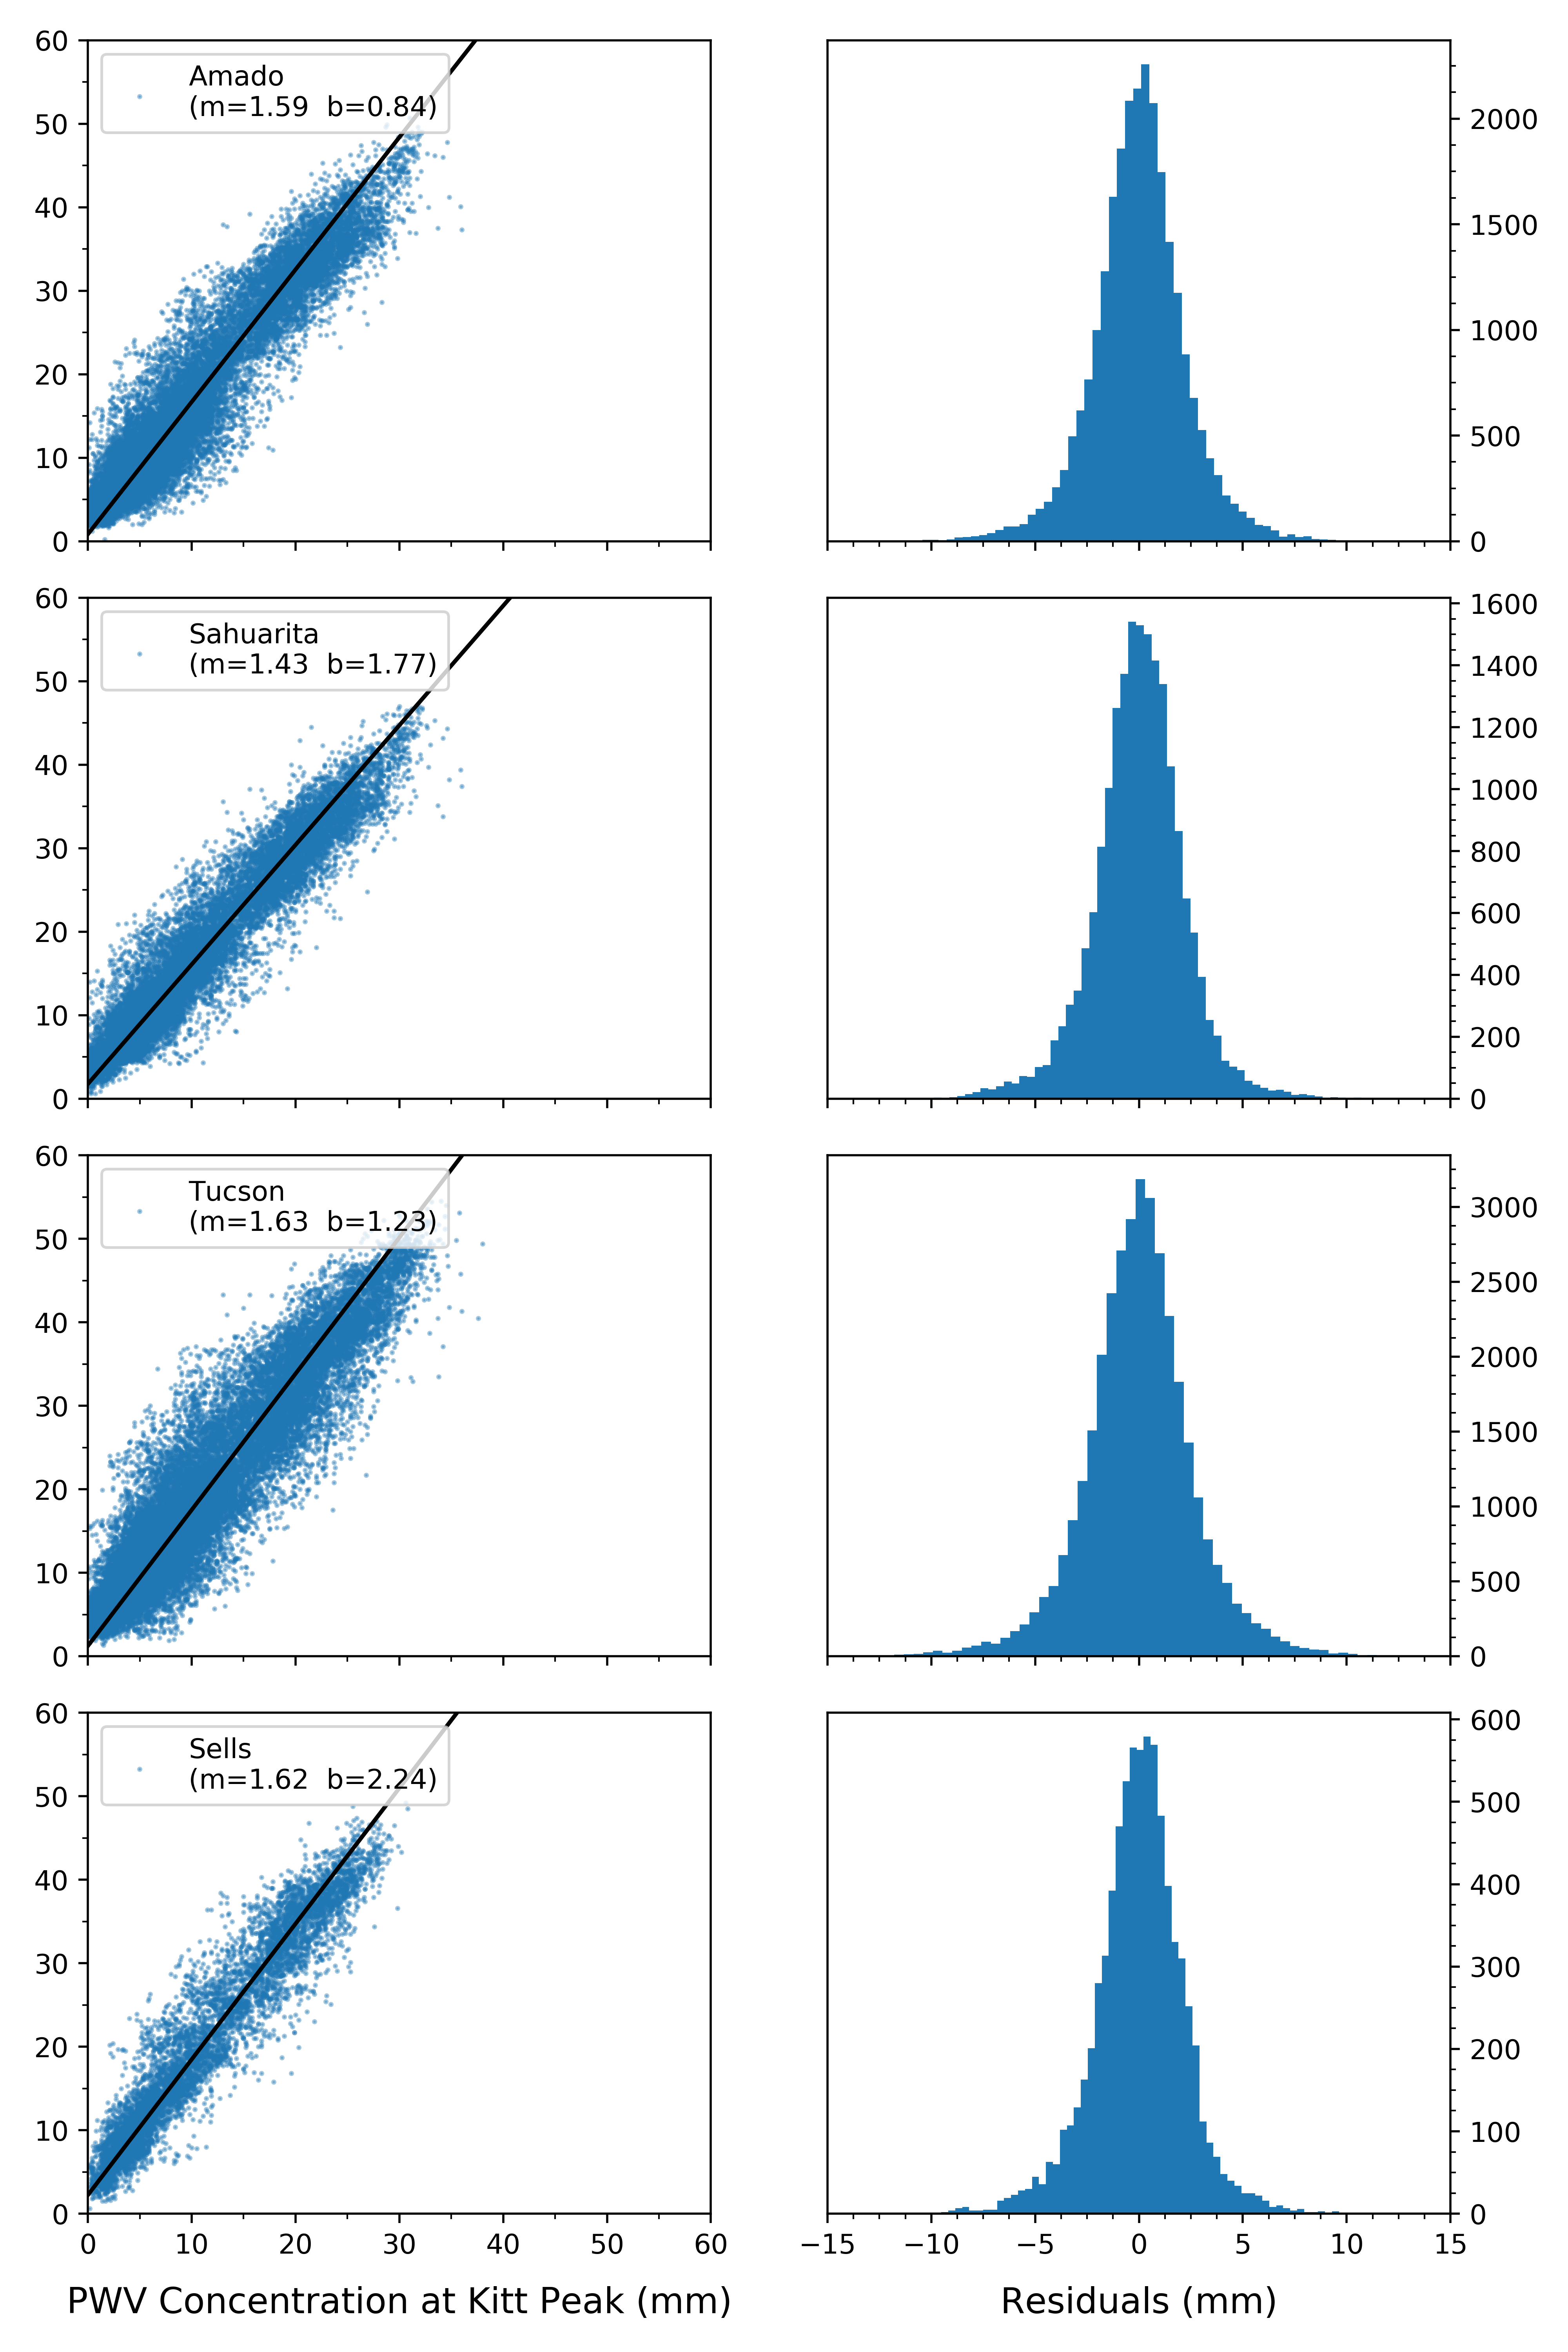
pwv_kpno uses linear fits to relate measurements of PWV taken by different GPS receivers. This figure demonstrates linear fits to PWV measurements taken at four different locations versus simultaneous measurements taken at Kitt Peak. Each row corresponds to a different location being compared against Kitt Peak, with measurements shown on the left and binned residuals shown on the right. The correlation in PWV column density between different sites allows the PWV column density at Kitt Peak to be modeled using measurements from other locations.
